An interactive image is a special image that has interactive hotspots that link to other content.
They are a great option to provide clickable points of interest on a self-guided tour floor plan on Info Point. This guide is intended to show you how to create an interactive image.

Before we start it is important to note that you can’t add interactive hotspots to a JPG or PNG. The format needs to be a scalable vector graphic (SVG), which is a very flexible file type supported by most modern browsers.
Creating and editing SVG files can seem like a daunting task and can become quite complicated if the drawing is very detailed but it is the ideal format for simple interactive maps and plans, as shown in the example above from St Barnabas Church in Brampton Bryan. Please note: the numbered hotspots on the example above won’t work because the SVG is programmed to open links on an Info Point.
Infinite scaling, no resolution loss
An SVG allows for infinite scalability with no loss of resolution. This means that you can use crisp, colourful graphics that can be magnified without becoming pixellated. SVG is written in extensible markup language (XML) that uses tags similar to HTML. This means that you can open an SVG file in a text editor and add tags for increased functionality such as adding hyperlinks.
If this all sounds like gobbledegook then why not speak to us about creating an interactive image on your behalf.
Creating a SVG
Although it is possible to write an SVG in a text editor, by far the most practical way of making one is by using graphics software and saving to .svg format.
If you have a graphics department designing your floor plan then ask them to provide you with the file in .svg format. The image should contain the floor plan and the number hotspots. If you are making your own images, programmes such as Adobe Illustrator, CorelDraw and Sketch are widely used, but licensed. Inkscape is a free vector drawing programme that supports the svg format.
This guide does not show you how to make your own graphics from scratch but it is worth investing time to learn one of the graphics packages referred to above. Please be aware of your organisation’s policy on software and any licensing requirements before installing any graphics software.
When a SVG is opened in a text editor such as Notepad (windows) or TextEdit (mac) it will look something like this (you can download the St Barnabas church tour floor plan above by right clicking on it).
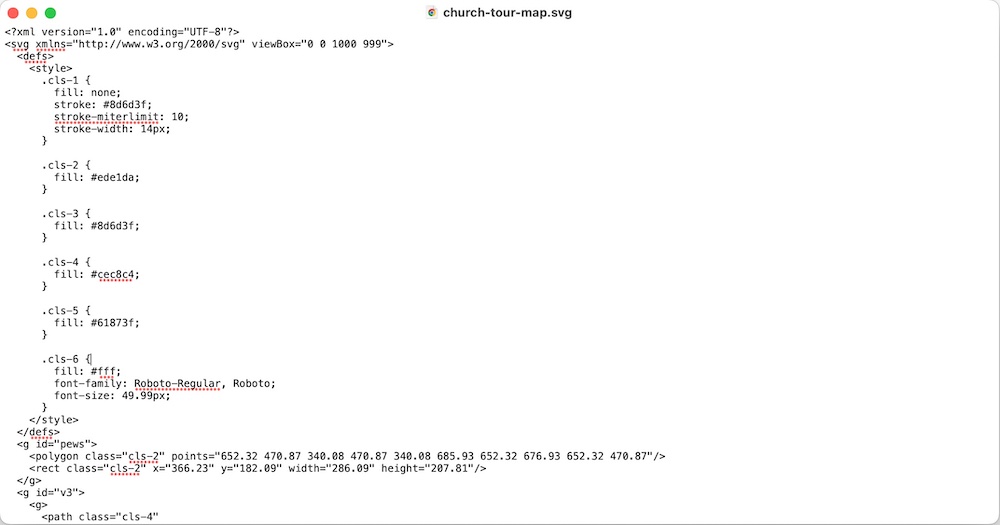
This shows the vector image as it is written in XML. This will vary in complexity and layout depending on the image, and the programme used to save/export it, but it will always follow a logical set of tags for each element. In this example the points of interest that we want to make interactive are green circles. In the XML this is written as:
<circle class=”cls-5” cx=”243.62” cy=”546.34” r=”40.46”/>
      <text class=”cls-6” transform=”translate(229.59 565.08)”><tspan x=”0”
y=”0”>1</tspan></text>
Don’t worry too much about what it all means as you don’t want to alter the appearance of the circles. You are just aiming to identify the bit of text that you will be adding your own tags around.
Now notice what is written around the XML describing the circle:
<a href="/p/tour-1-rogers-family-tablet">
<circle class=”cls-5” cx=”243.62” cy=”546.34” r=”40.46”/>
      <text class=”cls-6” transform=”translate(229.59 565.08)”><tspan x=”0”
y=”0”>1</tspan></text>
</a>
In HTML this <a> tag is known as a hyperlink and means that whatever is tagged becomes a button taking you to the location described in the href. In this case it is the location of a page created on the PlaceMaker Content Management System.
By adding these tags and incorporating the correct paths you can add interactivity to your own graphics.
Tutorial
1. Tap this link to open a SVG of a green button in your browser. When you click on the button nothing happens.
2. Now right click the link above and save it locally to your computer.
3. Open the SVG in a text editor. You may need to right click the file to choose which application to open it with. You will see it has a a very short bit of code as it is a simple graphic. The part we are interested in is within the <g> or group tags.
<g>
<circle fill="#61873F" cx="68.3" cy="74.1" r="54"/>
<text transform=”matrix(1 0 0 1 38.6042 80.347)” fill=”#FFFFFF” font- family=”Arial” font-size=”24px”>Press</text>
</g>
4. Now we will add the <a> tags required to turn the graphic into a link. Your code should look like this:
<a href="">
<g>
     <circle fill=”#61873F” cx=”68.3” cy=”74.1” r=”54”/>
     <text transform=”matrix(1 0 0 1 38.6042 80.347)” fill=”#FFFFFF” font-
family=”Arial” font-size=”24px”>Press</text>
</g>
</a>
5. Now lets add the URL that we will be taken to when we click the graphic:
<a href=”https://www.w3schools.com/graphics/svg_intro.asp”>
<g>
     <circle fill=”#61873F” cx=”68.3” cy=”74.1” r=”54”/>
     <text transform=”matrix(1 0 0 1 38.6042 80.347)” fill=”#FFFFFF” font-
family=”Arial” font-size=”24px”>Press</text>
</g>
</a>
6. Save and close the SVG in notepad and open it again in the browser. When you hover over the button the cursor should turn into a pointing finger. If you click on the button it should take you to the W3Schools SVG Tutorials page.
Thats it. The key difference between what you have just done and what works on Info Point is that Info Point is not connected to the internet so the link you use in the <a href=””> tag will be another page on the Info Point site rather than a web address and therefore will have this format <a href=”/p/slug-name”>. The slug is the unique name you give to each page (below the page name on the Details tab of the CMS).
The slug preceded by /p/ as part of the identifier. If you connect to your Info Point and browse as a visitor you will see the slug in the browser address bar.
Extra tutorial
Calling the button ‘Press’ might a little confusing so lets change it to read ‘Click’. We could open it up in a graphics programme to change the word but we could do it using notepad instead.
1. Open the SVG in notepad and find this bit of code:
<text transform=”matrix(1 0 0 1 38.6042 80.347)” fill=”#FFFFFF” font-family=”Arial” font-size=”24px”>Press</text>
2. Change the word Press to Click
<text transform=”matrix(1 0 0 1 38.6042 80.347)” fill=”#FFFFFF” font-family=”Arial” font-size=”24px”>Click</text>
3. Let’s make the font orange as well. Locate the part of the code relating to the font fill:
<text transform=”matrix(1 0 0 1 38.6042 80.347)” fill=”#FFFFFF” font-family=”Arial” font-size=”24px”>Click</text>
4. Change it to an orange colour. This way of writing colours is known as HEX code. Each colour has its own six digit alphanumeric code :
<text transform=”matrix(1 0 0 1 38.6042 80.347)” fill=”#f7931e” font-family=”Arial” font-size=”24px”>Click</text>
5. Now save and close the SVG in the text editor and open it up in the browser,. It should read Click and look great (sort of). Try changing other values and see what happens – can you make the circle smaller and coloured blue?
This tutorial was written by Ian Atkins, Graphics Office, Wessex Archaeology.
Interactive floor plan
If you’ve been able to follow the tutorials above then you are ready to make your own interactive floor plan for Info Point.
For each numbered hotspot you have created in the SVG you will need to add the tags and slug identifier. Save you file when you open it the interactive image should appear in your browser. When you hover over or click one of the numbers now what do you see?
If you would like support creating an interactive image then please get it touch. We do charge a fee for creating them.